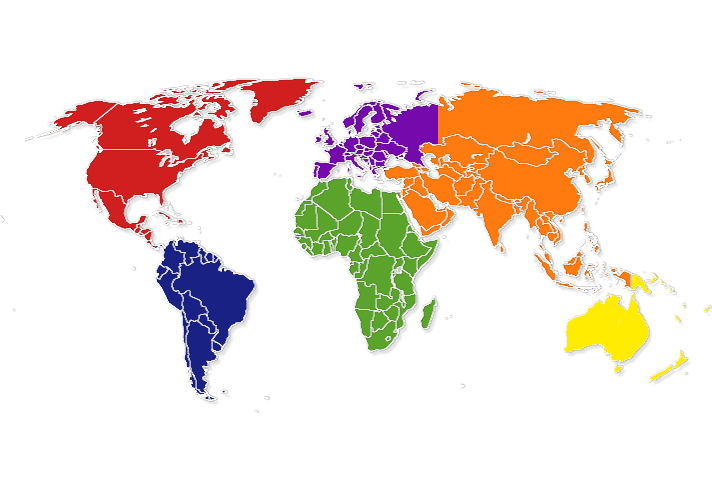
Worldwide Sugar Production and Consumption Data
Please hover over the countries to bring up information on sugar production levels and adult consumption values from dietary studies.
UK
Production: 1,429,000 Metric Tons Beet
Consumption1: Total sugars=96.5g/d; 20.3% Food Energy;
Non-Milk Extrinsic Sugars=58.8g/day; 12.1% Food Energy
(2008-2012)
For further information on UK consumption please click here
US
Production: 7,695,000 Metric Tons Beet & Cane
Consumption2: Total sugars=117g/d; 20.6% Food Energy;
Added Sugars=42g/day; 9% Food Energy
(2009-2010)
Thailand
Production: 10,569,000 Metric Tons Cane
Consumption: Not currently available
Sweden
Production: 453,000 Metric Tons Beet
Consumption3: Sucrose=46.5g/day
(2003)
New Zealand
Production: 0
Consumption4: Total sugars=117.3g/d; 19.8% Food Energy
(2006)
Norway
Production: 0
Consumption5: Added sugars=42g/d
(2010-2011)
Ireland
Production: 0
Consumption6: Total sugars=91.6g/d; 17.7% Food Energy
(2008-2010)
Italy
Production: 551,000 Metric Tons Beet
Consumption7: Total sugars=82.8g/d; 14.5% Food Energy
(2005-2007)
Germany
Production: 4,638,000 Metric Tons Beet
Consumption8: Total sugars=118.5g/d; 20.1% Food Energy
(2006)
France
Production: 5,193,000 Metric Tons Beet
Consumption9: Total sugars=95g/d; 16.5% Food Energy
(2003-2007)
Finland
Production: 131,000 Metric Tons Beet
Consumption10: Sucrose=48g/d
(2007)
Denmark
Production: 564,000 Metric Tons Beet
Consumption11: Added sugars=48g/d; 9% Food Energy
(2003-2006)
China
Production: 12,341,000 Metric Tons Cane
Consumption: Not currently available
Canada
Production: 132,000 Metric Tons Beet
Consumption12: Total sugars=106.7g/d; 19.9% Food Energy
(2009)
Belgium
Production: 955,000 Metric Tons Beet
Consumption13: Total sugars=20.5% Food Energy
(2004)
Austria
Production: 593,000 Metric Tons Beet
Consumption: Not currently available
Australia
Production: 3,733,000 Metric Tons Cane
Consumption13: Total sugars=123.8g/d; 20.5% Food Energy
(1995)
Turkey
Production: 2,470,000 Metric Tons Beet
Consumption: Not currently available
Russia
Production: 5,413,000 Metric Tons Beet
Consumption: Not currently available
Mexico
Production: 5,258,000 Metric Tons Cane
Consumption: Not currently available
India
Production: 28,800,000 Metric Tons Cane
Consumption: Not currently available
Brazil
Production: 37,133,000 Metric Tons Cane
Consumption: Not currently available
Netherlands
Production: 1,085,000 Metric Tons Beet
Consumption15: Total sugars=113g/d (median); 18.8% Food Energy
(2007-2010)
References:
Production values are for centrifugal sugar production from Sugar Economy Europe (2013) Bartens/ Mosloff 59th Edition
Consumption values are from:
1 Public Health England (2014) National Diet and Nutrition Survey: Results from Years 1-4 (combined) of the Rolling Programme (2008/2009 – 2011/12) https://www.gov.uk/government/uploads/system/uploads/attachment_data/file/310995/NDNS_Y1_to_4_UK_report.pdf
2 U.S. Department of Agriculture, Agricultural Research Service (2012) Nutrient Intakes from Food: Mean Amounts Consumed per Individual, by Gender and Age, What We Eat in America, NHANES 2009-2010. Available from: http://www.ars.usda.gov/Services/docs.htm?docid=18349
3 Swedish National Food Administration. Riksmaten 1997-98. Dietary habits and nutrient intake in Sweden: The second national food consumption survey. Available from: http://www.slv.se/en-gb/group1/food-and-nutrition/dietary-surveys1/riksmaten-1997-98-dietary-habits-and-nutrient-intake-in-sweden/
4 University of Otago and Ministry of Health (2011) A Focus on Nutrition: Key findings of the 2008/09 New Zealand Adult Nutrition Survey. Wellington: Ministry of Health. Available from: http://www.health.govt.nz/publication/focus-nutrition-key-findings-2008-09-nz-adult-nutrition-survey
5 Helsedirektoratet (2012) Norkost 3 En landsomfattende kostholdsundersøkelse blant menn og kvinner i Norge i alderen 18-70 år, 2010-11. Available from: http://www.helsedirektoratet.no/publikasjoner/norkost-3-en-landsomfattende-kostholdsundersokelse-blant-menn-og-kvinner-i-norge-i-alderen-18-70-ar/Publikasjoner/norkost-3-is-2000.pdf
6 Irish Universities Nutrition Alliance (2011) National Adult Nutrition Survey: A summary report. Available from: http://www.iuna.net/wp-content/uploads/2010/12/National-Adult-Nutrition-Survey-Summary-Report-March-2011.pdf
7 Sette S, Le Donne C, Piccinelli R et al (2011) The third Italian National Food Consumption Survey, INRAN-SCAI 2005-06--part 1: nutrient intakes in Italy. Nutr Metab Cardiovasc Dis 12, p.922-32
8 Bundesforschungsinstitut für Ernährung und Lebensmittel (2008) Nationale Verzehrs Studie II: Die bundesweite Befragung zur Ernährung von Jugendlichen und Erwachsenen Karlsruhe: Max Rubner-Institut. Available from: http://www.was-esse-ich.de/uploads/media/NVSII_Abschlussbericht_Teil_2.pdf
9 Dubuissona C, Lioreta S, TouvieraM et al (2010) Trends in food and nutritional intakes of French adults from 1999 to 2007: results from the INCA surveys. The British journal of nutrition 103: 1035-1048
10 Pietinen, P., Paturi, M., et al. (2010). FINDIET 2007 Survey: energy and nutrient intakes. Public Health Nutrition: 13(6A): 920–924.
11 Fødevareinstituttet, Danmarks Tekniske Universitet (2008) Danskernes kostvaner 1995-2006 Status og udvikling med fokus på frugt og grønt samt sucker Available from: http://www.food.dtu.dk/upload/f%C3%B8devareinstituttet/food.dtu.dk/publikationer/tilbagevendende_
publikationer/kostunders%C3%B8gelser/danskernes_kostvaner_1995-2006.pdf
12 Temme, E., I. Huybrechts, et al. (2010). Energy and macronutrient intakes in Belgium: results from the first National Food Consumption Survey. The British journal of nutrition 103(12): 1823-1829.
13 Commonwealth Department of Health and Aged Care. (2001). Comparable data on food and nutrient intake and physical measurements from 1983, 1985 and 1995 national surveys. Available from: http://www.health.gov.au/internet/main/publishing.nsf/Content/6A40E29D690738DECA25725F00810008/$File/nutrient.pdf
14 National Institute for Public Health and the Environment (2011) Dutch National Food Consumption Survey 2007-2010: Diet of children and adults aged 7 to 69 years. Available from: http://www.rivm.nl/bibliotheek/rapporten/350050006.pdf